Revenue leakage dashboard
Six places money leaves a job shop quietly. Not a chart wall — six numbers, each with the list of records underneath it that you can act on today.
In short
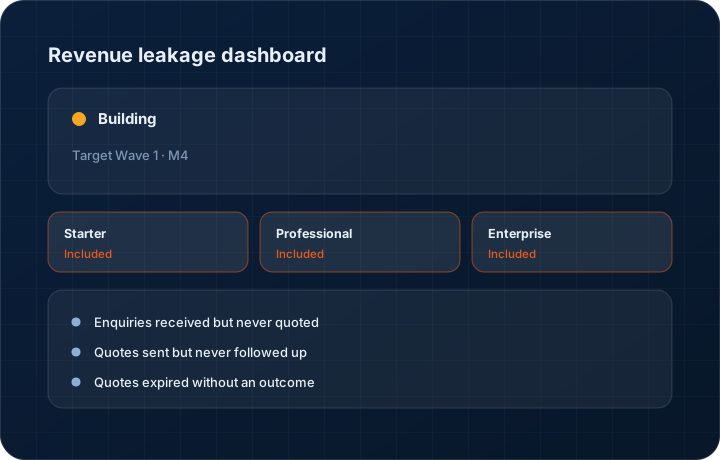
The revenue leakage dashboard surfaces six specific ways money is lost in a manufacturing business — enquiries never quoted, quotes never followed, quotes expired, lines below margin floor, dispatches never invoiced and receivables past terms. It is in development for Wave 1 Milestone 4; Starter carries three metrics, Professional and Enterprise the full six.
What it is
Shops lose money in ways that never appear on a profit and loss statement as a line item. An enquiry that was never quoted is not a loss anyone records. A dispatch that was never invoiced looks like a slow month. A quote that expired unopened is filed as a loss to a competitor who never even bid.
The dashboard names six of these and puts a number and a list against each. The list is the point: every metric drills straight into the records behind it, so the dashboard produces work rather than a discussion. On Starter it shows three metrics; the full six are on Professional and Enterprise.
Capabilities
What it does
Enquiries received but never quoted
The RFQs that came in and never produced a quote or a recorded no-quote decision. In most shops this is the largest and least visible number on the page.
Quotes sent but never followed up
Quotes past their follow-up date with no logged call, message or email. The Quote Follow-Up Agent drafts the chase; this is the list it works from.
Quotes expired without an outcome
Quotes that passed their validity date with no win, loss or revision recorded. An expired quote with no outcome is a sale nobody closed and nobody learned from.
Lines sent below the margin floor
Quoted lines priced under the applicable floor, with and without approval, grouped by customer and product family so a pattern of concession is visible.
Dispatched but not invoiced
Order lines where goods have shipped and no invoice has been raised. This is real money already spent on material and labour, sitting uninvoiced.
Receivables past terms
Invoiced value past due by aging bucket, tied to the salesperson who owns the account rather than only to the finance team.
Step by step
How it works
The order these steps happen in matters more than the feature list above it.
- 1
The dashboard reads live records
Nothing here is a separate data entry exercise. Every metric is computed from the RFQs, quotes, orders and invoices already in the system.
- 2
Set your thresholds
Follow-up interval, margin floor and payment terms come from your own configuration, so the numbers reflect your standards rather than a default.
- 3
Read the six numbers
Each metric shows a count and a value. Value is what makes the ranking honest — forty small leaks may matter less than two large ones.
- 4
Drill into the list
Every metric opens the records behind it. The dashboard's output is a work list, not a chart to screenshot for a meeting.
- 5
Work it and watch it move
The numbers update as the records change, so the effect of a week of follow-up calls is visible rather than assumed.
What this is not
This is not a business intelligence tool — six fixed manufacturing leakage metrics with drill-through, not a report builder or a custom query surface.
This is not an ERP, MRP, CAD, BOM, or advanced CPQ system — it manages customer RFQs, quotes, follow-ups, and order handoff.
Tier availability
What you get on each plan
These rows come from the same feature matrix the pricing page publishes. If the two ever disagree, the matrix is wrong and we fix it.
| Plan | Availability |
|---|---|
| Starter | 3-metric version. |
| Professional | Full 6-metric dashboard. |
| Enterprise | 6-metric dashboard plus custom metrics. |
Starter is $39 per user per month, Professional $49, Enterprise $99 plus a $2,000 monthly platform fee. Annual billing is 17% lower. See the full matrix.
Interface
What it looks like
Development build of the six-metric leakage dashboard showing count and value against each metric.
Development build capture. All figures are sample data.
Development build of the drill-through list behind 'dispatched but not invoiced', showing eleven order lines.
Development build capture, not production.
Screenshots are described rather than mocked up. Captures are taken from the build current at the date shown in the changelog, on a sample workspace.
Questions about revenue leakage dashboard
In development with a Wave 1 Milestone 4 target. It depends on the RFQ record and the margin guardrails, which are being built for the same and adjacent milestones.
Related features
Owner command centre
Manufacturing owner command centre
Read moreMargin guardrails
Margin guardrails on line items
Read moreInvoice editor
Invoice editor with credit and debit notes, aging and credit management
Read moreWhat's shipping today
All 47 features grouped by status on one page, with the newest releases alongside.
Read moreSee a live quote draft built from a real RFQ
Fourteen days, no credit card, sample data pre-loaded. If it does not fit your shop, we will tell you in the first call.
- Delaware LLC
- SOC 2 Type II
- USA Data Centers (AWS)